Using Twitter Sentiment for Intraday Signals

This is a cross-post from Trade The Sentiment. Originally published as Using Twitter Sentiment for Intraday Signals.
While most of my research on Twitter Sentiment has been for use on larger time-frames (Daily, Weekly, etc), I’ve been very curious about using sentiment for intraday signals.
I finally found some time to hack together a script that would look at sentiment data intraday…and now i’m a bit unhappy that I did…because I’m fascinated with the intraday signals I’m seeing.
An Example
On Feb 25, we saw a nice little sell-off. The S&P500 gapped up to open the day and sold off for the remainder of the day for a loss of almost 38 points on the $SPX.
The following day, Feb 26, saw another move down until about mid-day when the markets ‘turned’ and started heading up…and we saw a retrace of about 40 points over the next three days.
Everyone seemed to be looking for a breakdown on Feb 25 and Feb 26 but it didn’t happen.
As luck would have it, over the weekend I had built my script to look at intraday sentiment. It was a quick hack (like most of my stuff) that allowed me to run a quick query to see what sentiment looks like at time “now”. On Feb 25, I was occasionally calling out the the intraday sentiment values in @gtotoy’s trading room over at DayTraderBootCamp (you should join if you aren’t a member…some GREAT traders there).
As the day wore on, I was noticing the sentiment was getting much more bearish…to the extent that it was in ‘bearish extreme’ levels by a large margin. At one point, the sentiment for the day was around 1.5 or so (1.0 is neutral, anything over 1.25 is considered a bearish extreme).
Twitter users were extremely bearish on the market on Feb 25 and the morning of Feb 26. On Feb 26th at 9:30 Central and again at 11:30 Central, there were 2 large bearish sentiment spikes…those times marked the same times that we saw the bottom in the market on that day (looking at at 15 minute chart).
At the time, I didn’t have the sentiment loaded up into a platform to view it against price action…but I’ve since fixed that.
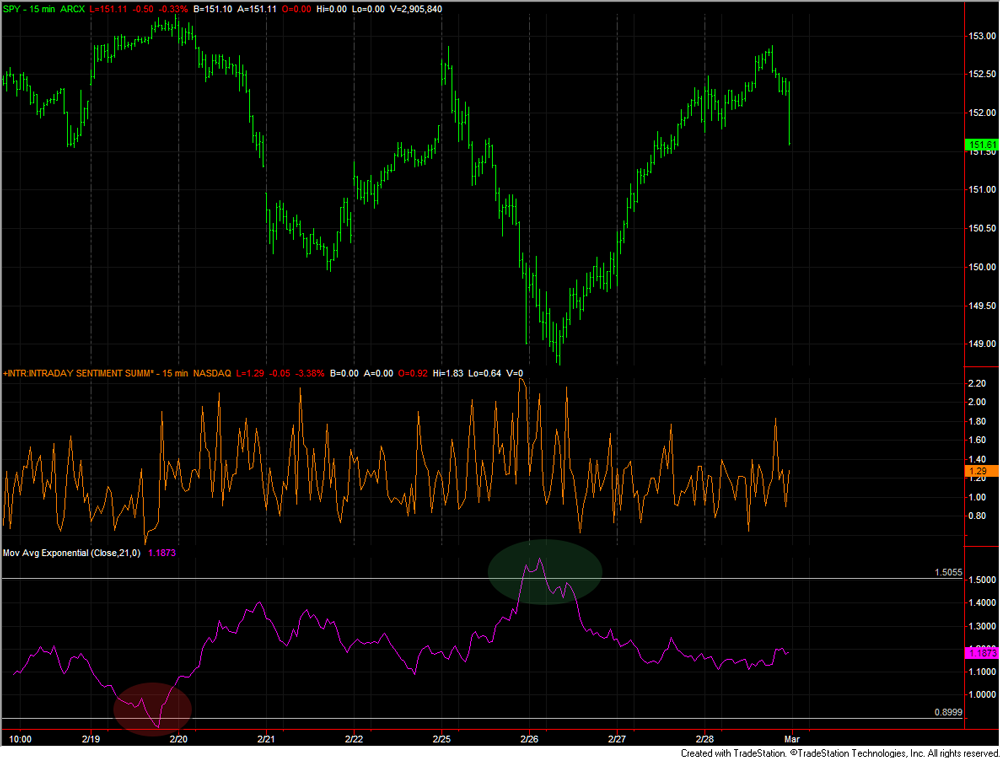
Take a look at the following….a chart showing a 15 minute candle chart of SPY Action (in green), Intraday Sentiment sampled in 15 minute increments (in Orange) and the 21 period EMA of the Intraday Sentiment (in Magenta).
You’ll notice that the sentiment chart is fairly noisy…but the 21 EMA is much cleaner and provides a couple nice ‘signals’ over the last few weeks. On the 21 EMA chart (bottom pane), you’ll see a Red oval that highlights a Sell signal with Bullish Extreme on Feb 19 and a Green oval that highlights a Buy Signal on Feb 25 / 26th with Bearish Extreme readings).
Note: a few days of data don’t make something useful. It could be pure happenstance that the below signals did what they did…but I’ll be looking at more historical data to see what I can find.
Click image for larger version


Comments ()