Can Twitter Sentiment be used to generate buy / sell signals?

This is a cross-post from TradeTheSentiment.com
Before we get started…its VERY easy to look back and say “yes…that would have been a buy signal”. If the market worked with hindsight, we’d all be millionaires.
For this approach, I’m going to use the thought that the masses are ‘wrong’. That is…when Sentiment gets extremely bearish or bullish, I’m going to go the opposite direction. If Extremely Bearish, I’m going Long. If Extremely Bullish, I’m going to short.
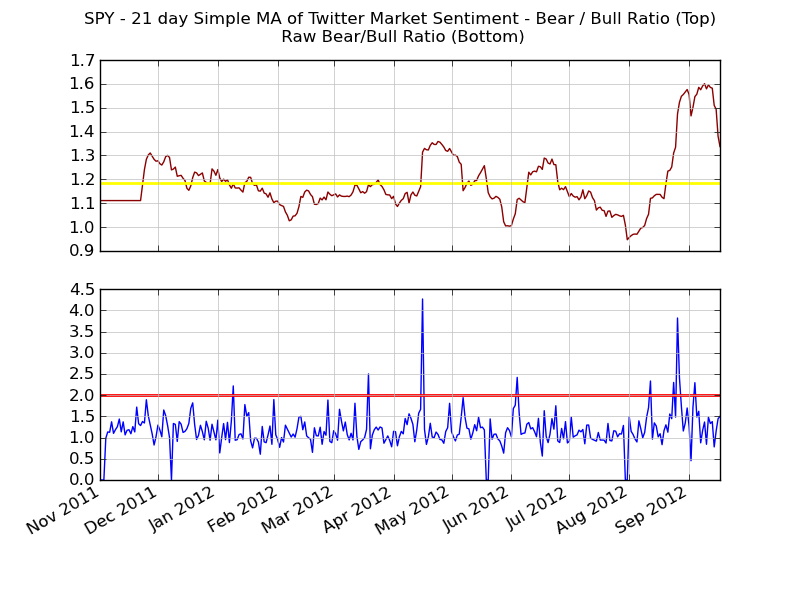
Finding the “extreme” is going to be a very subjective approach. For the purposes of this study, I will use the Daily Bear / Bull Sentiment chart. When the sentiment spikes over a 2.0 (a level of 2.0 on the Bear / Bull chart means the sentiment is twice as bearish as bullish), I will go long.
For this study, I apply this strategy to the S&P 500 ETF – SPY.
The entry criteria:
- An “extreme” is found in the Bear / Bull Daily Sentiment Chart. This is defined as any reading over 2.0.
- Long only. When an an extreme is found, I’m going to go Long the underlying stock at Market Open the next day. All orders will be entered as “market at open” orders.
- # of Shares = 500.
- Commissions = Not included.
- Slippage=10 cents (included on entry and exit)
- Stop = $2 (trailing) (e.g., if entry is at $140.00, the stop is at $138.00 and it moves up as price moves up).
- If I am still in the trade upon a new extreme, no action is taken.
- Timeframe: Nov 1 2011 to Sept 18 2012
SPY
Peaks are found on the following days (review signals above the red horizontal line in the bottom pane of the chart)
- Jan 9 2012
- March 19 2012
- April 16 2012
- June 4 2012
- August 12 2012
- August 24 2012
- August 26 2012
- August 27 2012
- Sept 4 2012
With the above dates of extremes in mind, let’s take a look at how an investment strategy using these peaks would do.
Trade #1
Extreme on Jan 9. On Jan 10, go long 500 shares at Market Open. SPY opened at 129.39. With slippage, Order is filled at 129.49. Stop set at 127.49.
Trade lasts 13 days and closes on Jan 27 when Trailing stop is hit for a Gain of +$1.56 per share or 1.20% return on investment.
Trade #2
Extreme on March 19. On March 20 2012, go long 500 shares at Market Open. SPY opened at $140.05. With slippage, Order is filled at $140.15. Stop set at 138.15.
Trade lasts 7 days and closes on March 28 when Trailing stop is hit for a Loss of $0.51 per share or a total return of -0.39% return on investment.
Trade #3
Extreme on April 16. On April 17 2012, go long 500 shares at Market Open. SPY opened at $137.94. With slippage, Order is filled at $137.94. Stop set at 135.94.
Trade lasts 5 days and closes on April 23 when Trailing stop is hit for a Loss of $1.41 per share or a total return of-1.09% return on investment.
Trade #4
Extreme on June 4. On June 5 2012, go long 500 shares at Market Open. SPY opened at $127.85. With slippage, Order is filled at $127.95. Stop set at 125.95.
Trade lasts 4 days and closes on June 8 when Trailing stop is hit for a Gain of $3.42 per share or a total return of 2.64% return on investment.
Trade #5
Extreme on August 12. On August 13 2012, go long 500 shares at Market Open. SPY opened at $140.70. With slippage, Order is filled at $140.80. Stop set at 138.80.
Trade hasn’t closed yet as stop hasn’t been hit. As of Sept 18, SPY closing price is $146.49. Stop is at $144.94. Current Gain of $4.14 per share or 3.2% return on investment.
No additional Trades taken since Trade #5 is still active.
Outcome of Strategy
5 trades, 5.56% return over 8 months.
In the same timeframe, the SPY ETF, if you were to buy 500 shares of SPY on Jan 10 (the date of the first trade) at the same price of my purchase @ 129.49 and hold them without a stop you’d have a gain of $17.13 per share for a 13.23% return. That said…you would have also seen a pullback to below your entry point (low of 126.48 on June 4 2012). Would you have stayed in that trade if it had gone against you $3?
Now…I’m not a “buy-and-hold” person. Too much stress. If I can make 5 trades with an average hold time of 11 days and pull out 5.56%, I’d be pretty happy.
That said…if I changed my trailing stop from $2 to $5…the outcome would have been different. With a trailing stop of $5, this approach would have made 3 trades for a total gain of $25.15 or 19.42% return and an average of 39 days per trade. Not bad, eh?
Now…this is by no means “proof” that sentiment can be used as a buy signal. During this uptrending market, I could probably have picked any day at random and run this same analysis and got similar results. But…you can say that about any strategy, no?
Note: For those who point out that commissions aren’t included in this calculation, please note that a $50 charge for commissions ($10 per trade round-trip) will not significantly alter the outcome of this strategy.
In the next few days/weeks I plan to share more of these ‘applications’…stay tuned.
If you want to keep up with more of my market related topics, jump over to my Market focused blog at TradeTheSentiment.com.
This is a cross-post from TradeTheSentiment.com


Comments ()