
11 years, 1400 blog posts...and a pretty graph

As part of a tutorial on Text Analytics and Visualization I just finished over on technical blog called Python Data (where I blog about using python for data analysis), I took a look at all 1400 posts over the last 11 years (11 years!). The findings weren’t surprising but they are interesting (at least to me).
First, a visualization. This is a network map of the top three keywords from each of my posts and their association with other keywords. To create this, I took each post and performed some natural language processing on it to find the keywords for each post and then created a matrix that describes the relationship between keywords in different posts.
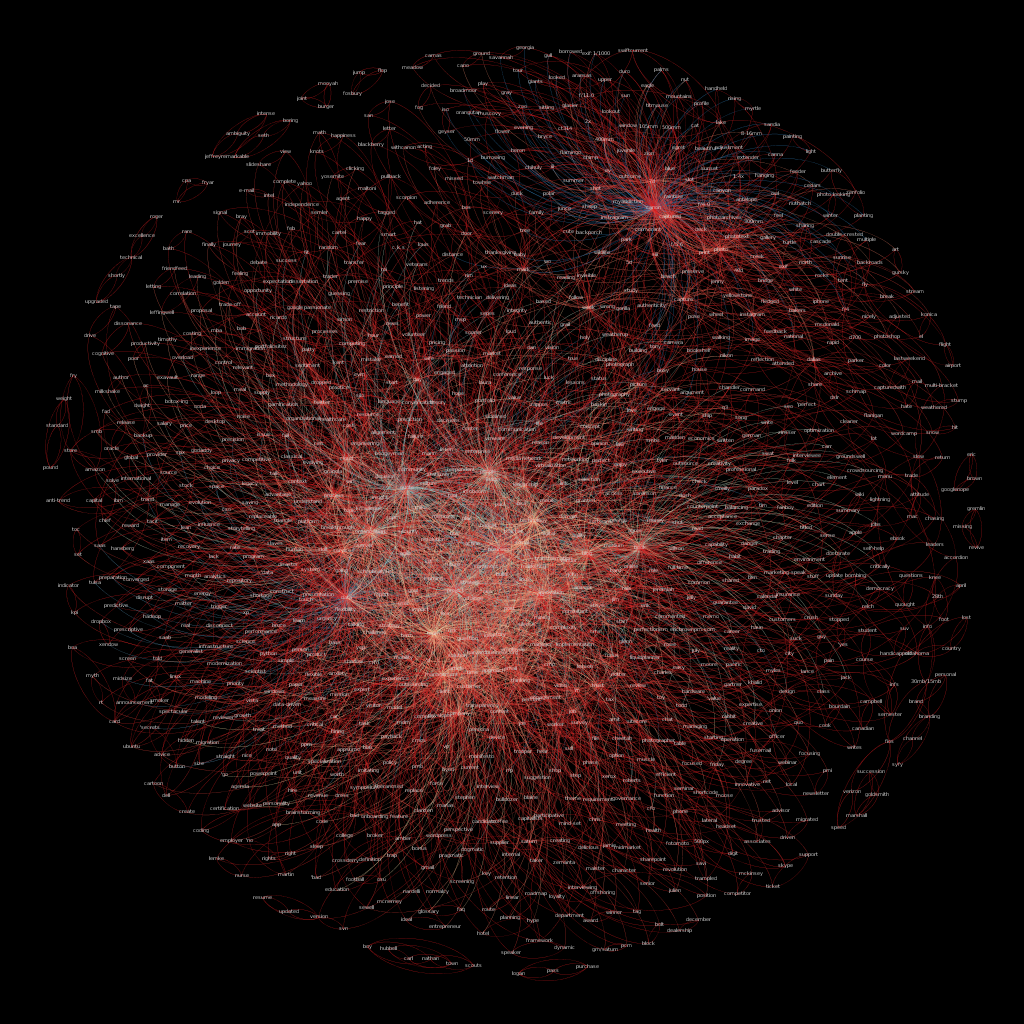
Its hard to tell from this image, but the large clusters revolve around ‘business’, ‘cio’, ‘data’, ‘people’, ‘project’ (which are all shown in the large cluster in the middle of the graph) and photography (the top right cluster). While not a bit surprised (I mean…this is the stuff I write about), it is really cool to see it all layed out like this and to see how things are connected together. For example, ‘business’ and ‘data’ are connected together a number of times as is ‘cio’ and ‘business’…which means I must be writing about the ‘right’ stuff because those things go together quite well.
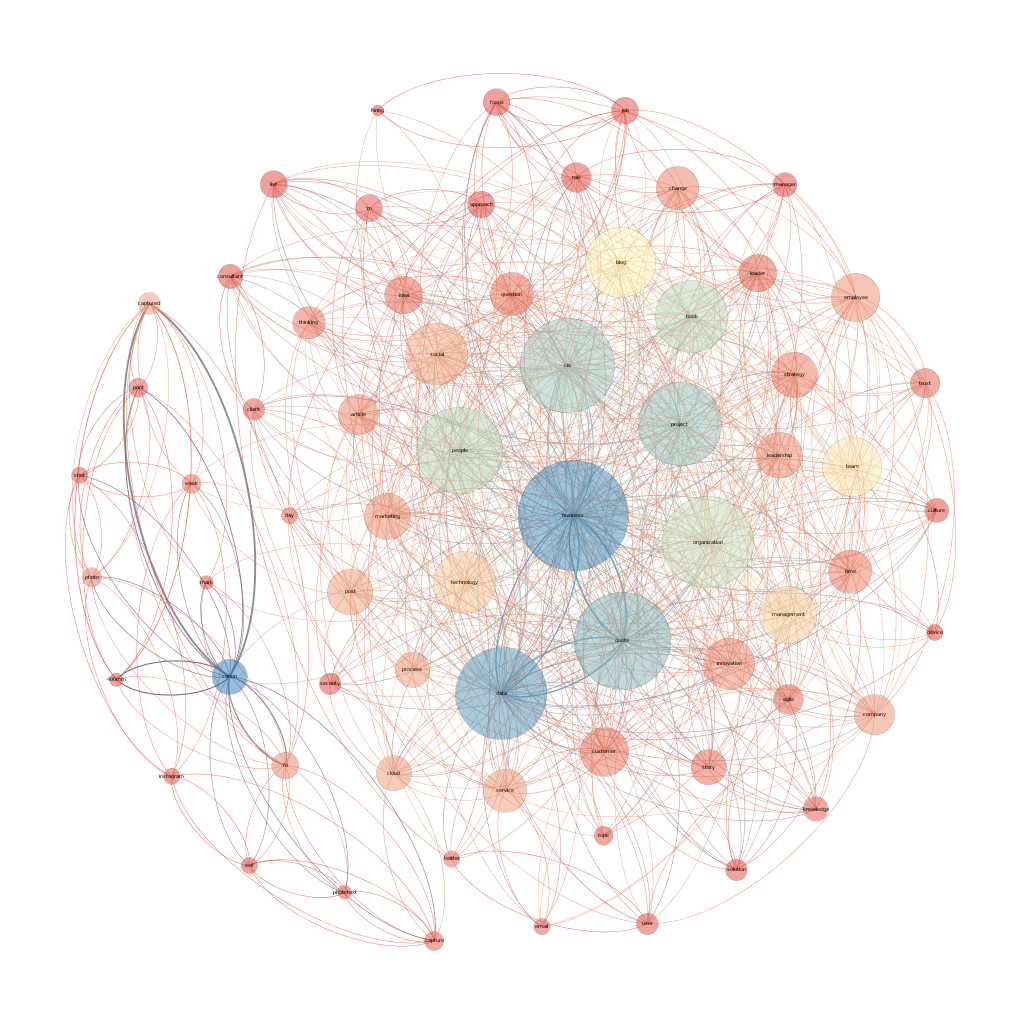
Here’s am much more readable version of the above graph with some filtering and node adjustments.
The top 10 keywords on the blog over the last 11 years are:
| keyword | |
|---|---|
| canon | 198 |
| quote | 162 |
| data | 146 |
| business | 132 |
| project | 80 |
| captured | 74 |
| cio | 65 |
| book | 60 |
| blog | 54 |
| organization | 51 |
Note: If I do this analysis again, I think I’d remove ‘quote’ from the text before doing any analysis since it really doesn’t add much value, but I left it in simply for completeness.
If you are technically inclined (and a python developer) you can jump over and read how I did this analysis on my Text Analytics and Visualization post.

Comments ()