
Correlations - Twitter Sentiment, AAII Sentiment Survey and the S&P 500 Index
This is a cross-post from Trade The Sentiment
I just finished presenting a paper titled Bulls, Bears…and Birds? Studying the Correlation between Twitter Sentiment and the S&P 500 Index at the Business Intelligence Congress 3 in Orlando Florida. Once the paper is formally published, I’ll share a link to the PDF. Oh….and the paper won best Research paper at the conference 🙂
A quote from the abstract of the paper:
This research had three main goals: 1.) To determine if data analytics can be used to automate sentiment analysis from Twitter messages; 2.) To determine whether the outcome of the analytical engine is comparable to existing survey methods and finally; 3.) To determine if there is any actionable knowledge contained within Twitter sentiment that can be used to make investing decisions.
Each of the above goals was accomplished. Twitter data can be collected and analyzed using standard sentiment analysis methods. Additionally, using Bayesian Classification techniques combined with a manually generated training data set, resulted in an outcome which is correlated to existing sentiment survey methods (e.g., the AAII Sentiment Survey). Lastly, using standard statistical methods, there is very little statistical correlation between the Twitter Sentiment found within this study’s sentiment analysis methods and the closing price of S&P 500 Index.
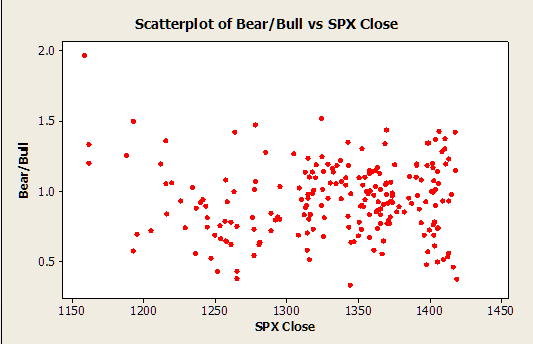
Using my training data set and the Python Natural Language Toolkit’s Naive Bayesian Classification methods and performing statistical correlations using the Pearson Correlation method, there is virtually no correlation between the overall market Daily Twitter sentiment and the Daily closing price of the SPX.
Using Pearson Correlation methods is a standard method of determining whether a linear relationship exists between between two sets of data. The correlation values range from +1 to -1 with a value of +1 meaning that there is a perfect linear correlation between the two data sets and a value of -1 meaning that there is a perfect inverse linear relationship between the two data sets. A value of 0 means there is no correlation between the two data sets. Note: looking for a linear relationship between sentiment and SPX Close price might be naive here, but its the simplest relationship to begin with.
A Scatterplot of Daily Twitter Sentiment Data and Daily SPX Close prices shows virtually no linear relationship exists.

Correlation Details of the Daily Bear/Bull Ration and SPX Close:

Additionally, there is virtually no correlation between the AAII Sentiment Survey and the SPX Weekly Closing Price nor is there any correlation between the Weekly Twitter Sentiment and the SPX Weekly Closing price.

There is, however, a fairly strong correlation between Twitter Sentiment on a Weekly Basis and the Weekly Sentiment Survey released by the American Association of Individual Investors (AAII) with a Pearson Correlation value of 0.583 being found.
Correlation Details of the AAII Weekly Sentiment Survey and Weekly Twitter Bear/Bull Ratio:

The conclusion?
Using my training dataset and my implementation of the Naive Bayesian classifier, there is no significant correlation between Twitter Sentiment and SPX Close Price on a Daily or Weekly Basis. That said, there is a High Correlation between Weekly Twitter Sentiment and the AAII Sentiment Weekly Survey.
Does this lack of correlation mean that Twitter Sentiment (or AAII Sentiment) is useless?
I don’t think so. In fact, I believe it is very important data.
I’ve written about the use of Sentiment Extremes as a buy/sell signal in the past and I see some real value in these signals. There a number of academic and industry articles describing the use of sentiment and sentiment extremes as contrarian signals. In fact, the AAII has even published an article that discusses the use of sentiment as a contrarian signal.
I’ve been focusing most of my efforts on identifying sentiment extremes and using those values as inputs into investing strategies. These entry signals appear to be providing exceptional returns with little drawdown when using proper risk management methods.
Additionally, these entry signals from extremes seem to be a better entry method than just taking a random entry as described in my post that compares a Bearish Extreme signal compared to entries taken with a random signal. In that article, it appears that additional returns found using Bearish Extremes from Twitter as an entry signal when compared to entering on a random entry signal.
In fact, using the overall sentiment from Twitter and using extreme levels as an entry signal has delivered pretty good returns over the past year…better than I even initially expect.
How good are the results? Check back in a few days for a report. 🙂
This is a cross-post from Trade The Sentiment

Comments ()