
Comparing Sentiment Extreme Entries with Random Entries - Multiple Symbols
This is a cross-post from Trade The Sentiment
In my post titled Correlations – Twitter Sentiment, AAII Sentiment Survey and the S&P 500 Index I mentioned the following:
Using my training data set and the Python Natural Language Toolkit’s Naive Bayesian Classification methods and performing statistical correlations using the Pearson Correlation method, there is virtually no correlation between the overall market Daily Twitter sentiment and the Daily closing price of the SPX.
While there isn’t any correlation between daily/weekly SPX closing prices and the overall Twitter market sentiment (using my analysis methods), there are some interesting signals coming out of this research into twitter sentiment.
The most interesting signal so far has been that of an “extreme” in sentiment. I’ve been running quite a lot of analysis using Twitter Sentiment Extremes as signals for entries and have been quite impressed with using Twitter Sentiment Extremes as entry signals.
I’ve shared a number of these analyses over the last few months. A few examples can be found in the following posts:
- Buying SPY Double Extremes (sentiment reading over 2.4)
- Twitter Sentiment Strategy – Backtesting SPY again
For the purposes of understanding how accurate these signals are, I setup the following test to compare Twitter Sentiment Extreme Signals vs Random Entries. I’ve run a portion of this test before in the Comparing Twitter Sentiment vs Random Numbers for Entry Signals post but I wanted take it a step further and test multiple symbols and compare Twitter Signals with Random Entries.
The strategy
Rather than just use one or two symbols, I wanted to take a look at how these Extreme signals would work across multiple symbols and markets. In addition, I have used the full market sentiment signal rather than the individual symbol sentiment signal in order to test the market sentiment signal in general.
I used the following symbols:
- Date Range: Nov 1 2011 to Dec 31 2012.
- Strategy is Long only
- Use overall Market Sentiment
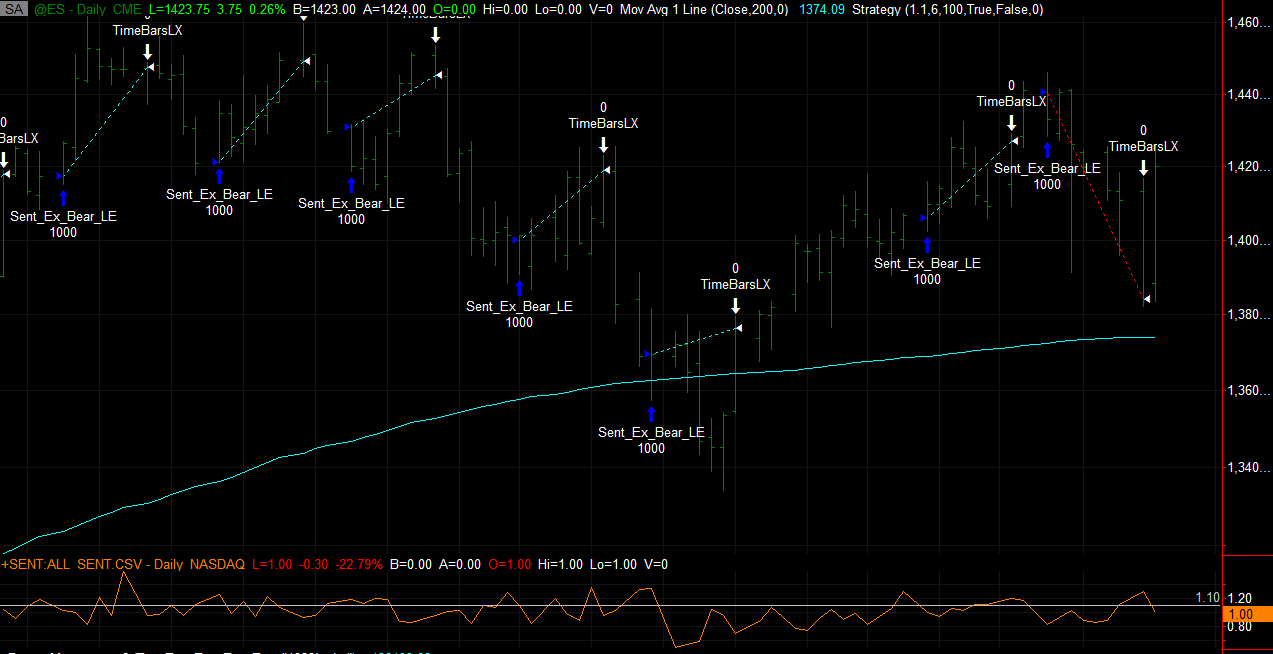
- Extreme is defined as a Bear / Bull Ratio of 1.1 or higher
- For futures, use 5 contracts. For Stocks/ETF’s, buy 500 shares
- Buy at open following day after an extreme is found
- Hold position for 6 days
- Commission and Slippage are included
- Returns are calculated on $300,000 account
Results of Twitter Sentiment Signals
Testing Random Signals
Next, I wanted to take a look at this same strategy and symbols using random entry signals. In order to get a good sampling of data, I created ten random signals using a random number generator and input these signals into Tradestation and ran the same strategy as above.
The results of the ten random entry signals averaged together:
Comparing Results
A quick glance of the Futures results shows a dramatic difference between the Twitter Signals and Random Entries.
When compared with the return of the S&P500 Index from Nov 1 2011 to Dec 31 2012 of 8.58% (found using Tradestation’s “Buy and Hold Return” performance statistic), the Twitter Sentiment signals provide an excellent market entry signal with excellent returns when used in the Futures markets. The returns found with ETF’s are surprising, but if we increase the number of shares purchases, returns increase a good deal (e.g., with SPY @ 500 shares, return 2.91% and with 1000 shares, return = 5.41%).
To improve performance, a lot of work can be done on risk management and exit criteria, which would most likely improve performance, but the purpose of this particular test was to compare random signals vs twitter sentiment…and I think the results speak for themselves: There seems to be a definite edge to be found in using Twitter Sentiment Extreme signals for entry signals.
This is a cross-post from Trade The Sentiment

Comments ()